Unsupervised classification looks for patterns in the data set, patterns that can be associated with “classes”. There are basically two kinds of patterns: clumps and tracks. Clumps exist because of similarity between objects, and tracks are formed by relationships. Most of the diversity in the Universe is due to evolution. Astronomical objects, such as stars, globular clusters or galaxies, evolve continuously according to physical laws governing their internal physics and chemistry, and also through interactions with their environment. Evolution in astrophysics is a continuous transformation, even during violent events. Apart from identifying classes of similar objects for synthetic purpose, astronomers are much interested between the evolutionary pathways.
A perfect and relatively simple example of these two tasks are the evolution of stars. The physics of stars is, to a first approximation, simple and depends on only two initial properties: mass and chemical composition (summarized as the metallicity). As a result, the classification of stars, based mainly on two observables (luminosity and temperature) and depicted on the Hertzsprung-Russell (HR) diagram, identifies the main evolutionary stages of stars as main classes (Main Sequence, red giants, white dwarfs…). The evolution of a given stars is relatively easily computed (again at first approximation). Stars go through most of these classes depending on their mass, the starting point each evolutionary track being defined by mass and metallicity.
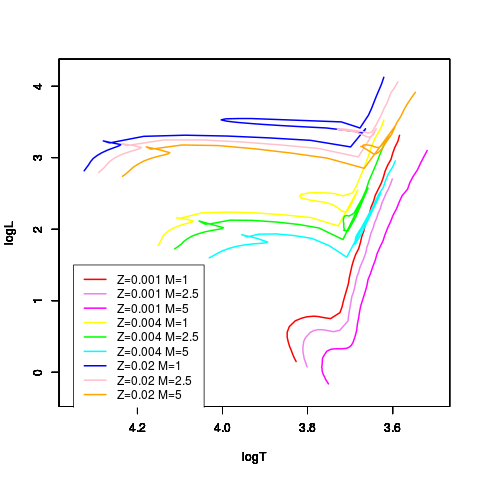
In the figure below, I show the evolutionary tracks of nine stars with three values of metallicities and three masses. The main sequence from which these computed tracks start is on the leftmost side of each track.
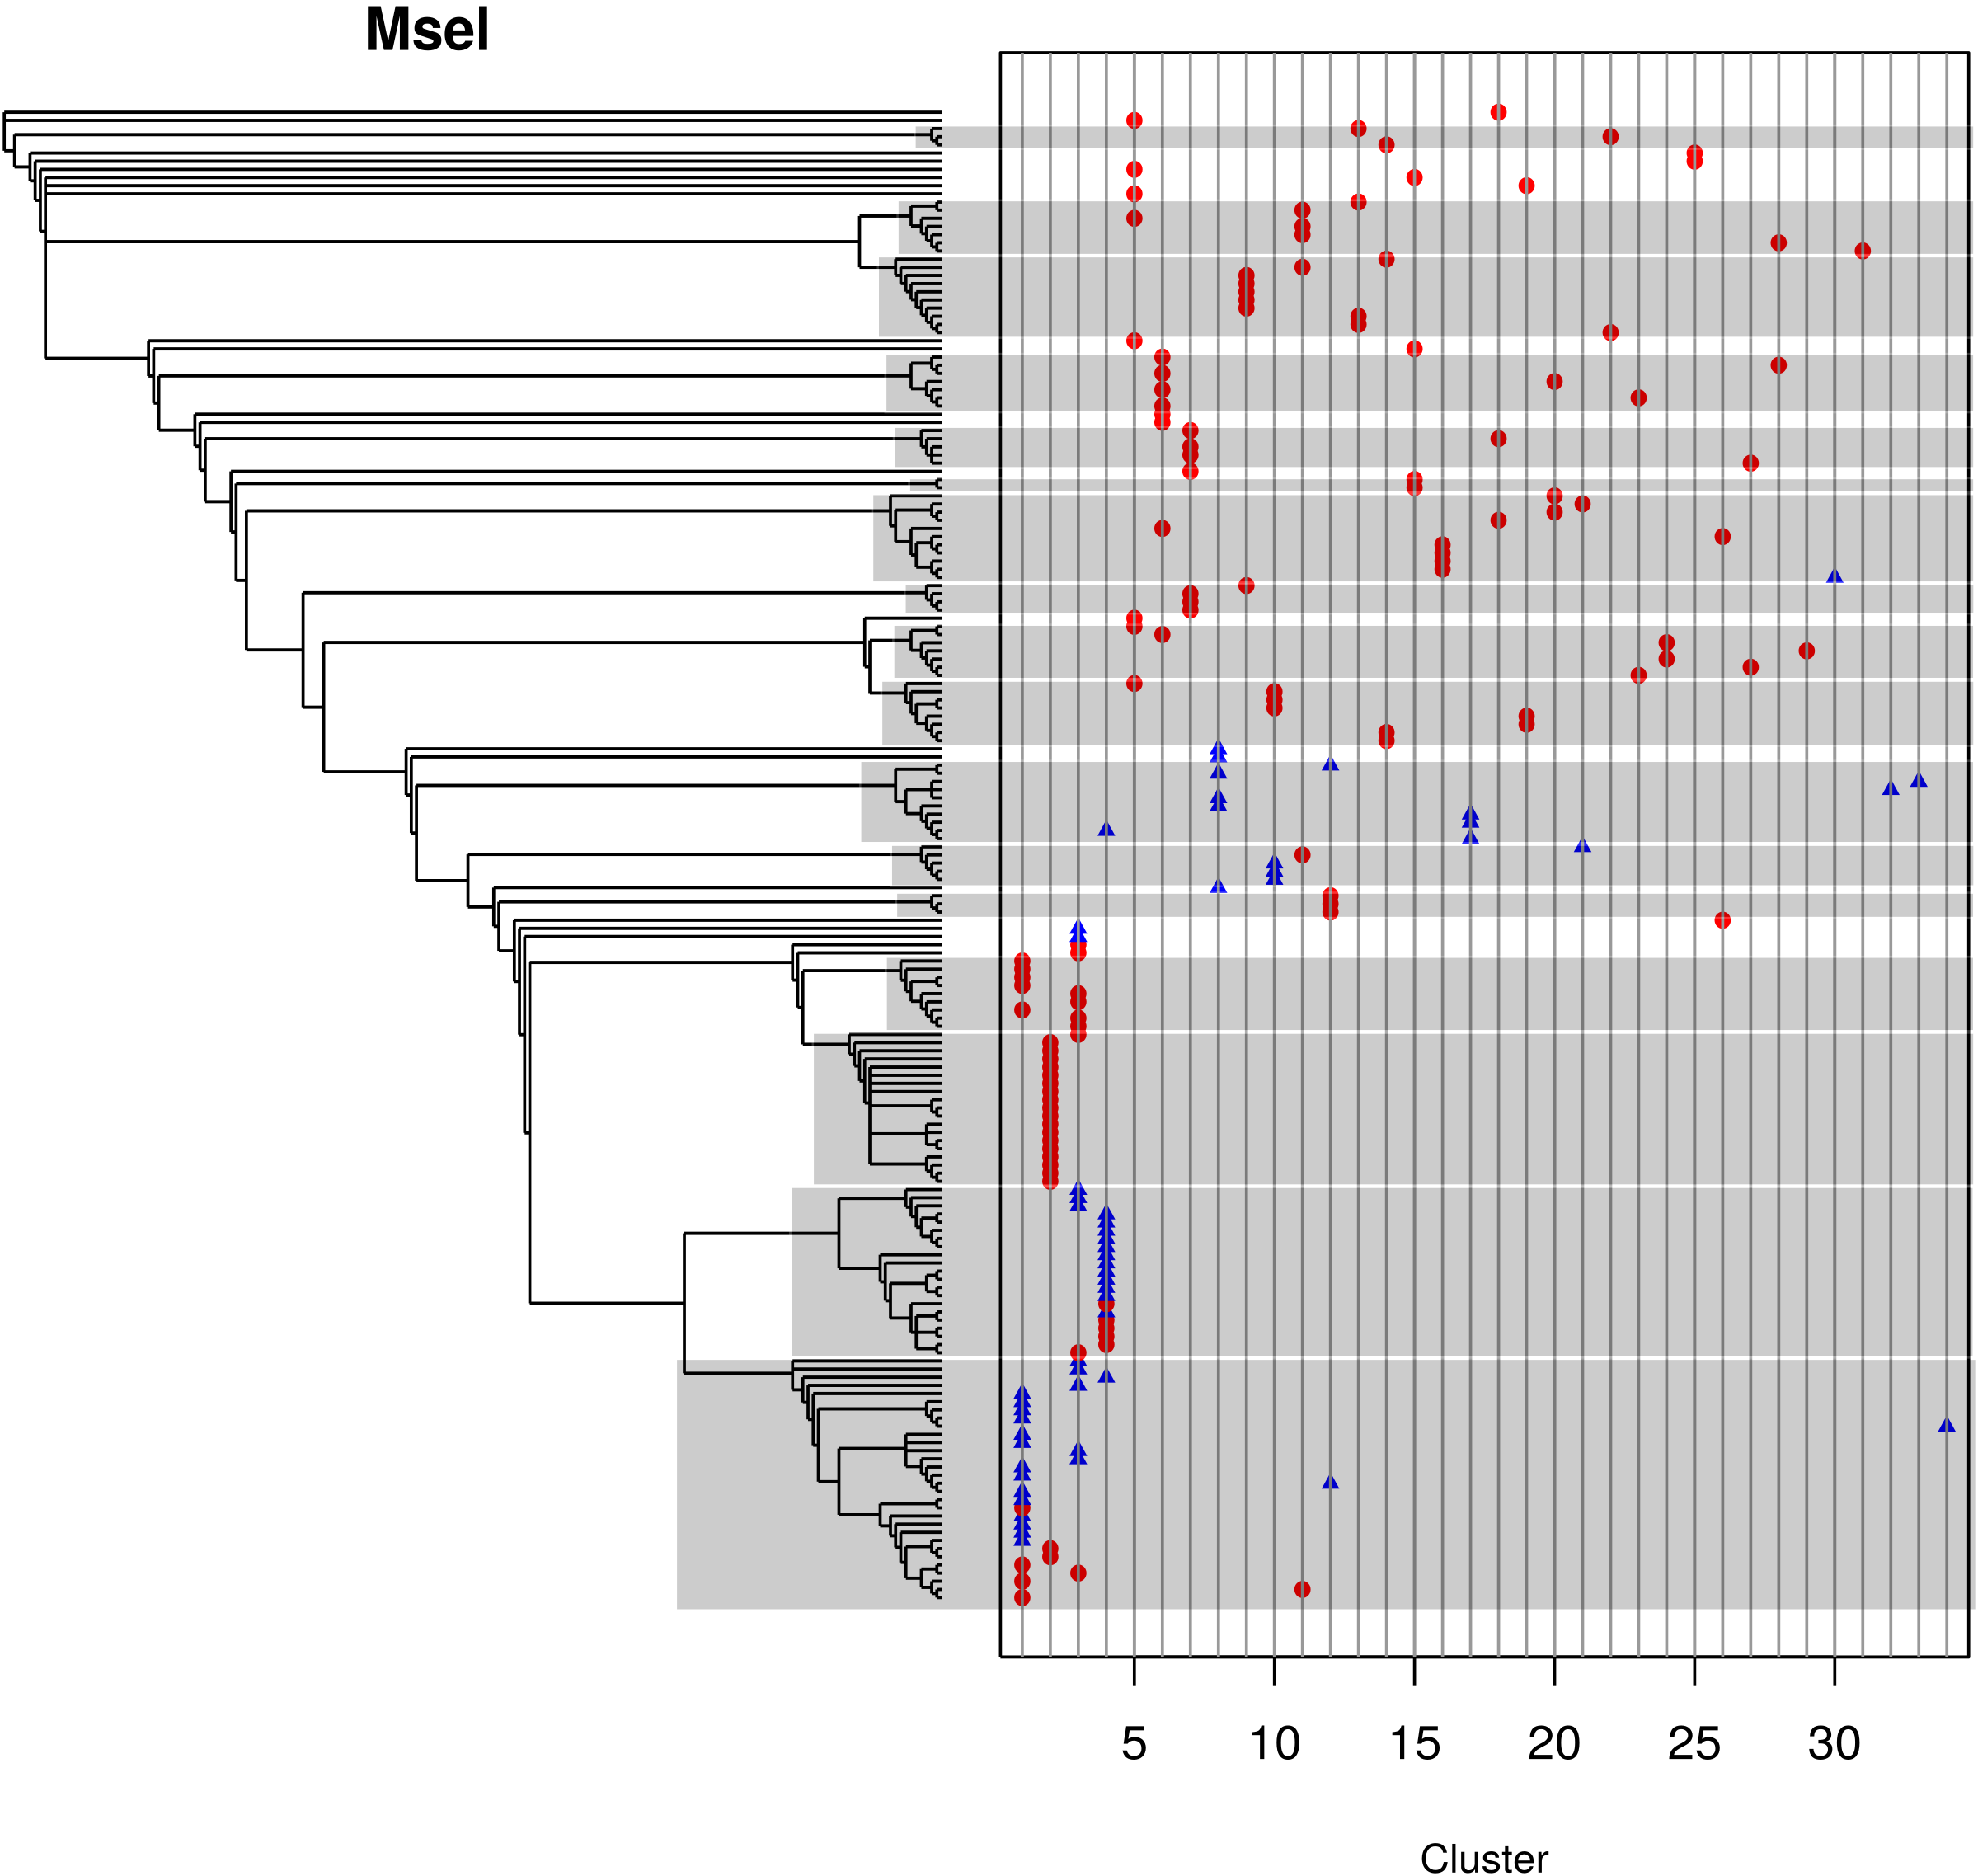
The goal is to reconstruct such evolutionary tracks from data. Statistical clustering techniques look for clumps and are thus obviously not adapted.
At first glance, stellar evolution does not seem to be a good case for a phylogenetic study. On one hand, the evolution of a star depends on only two parameters (mass and metallicity), so that a lineage can be easily defined as the evolutionary path of stars having initially the same two parameters. But on the other hand, the branching pattern is not obvious since there is no interaction between stars. However, i) there is an indirect physical relationship between the lineages through the explosions of the most massive stars the gas of which forms the new stars (transmission with modification), and ii) the link could be merely conceived mathematically as a change of the parameters in the continuum of possible values.